Traditional observability doesn't work for AI. Logs tell you the request succeeded, but not whether the response made sense. Metrics show latency, but not quality. And the bill? That skyrocketed because you didn't realize one endpoint was using 10x more tokens than expected.
If you're building apps with LLMs (or integrating multiple AI models), monitoring status codes and error rates isn't enough anymore. You need to monitor the AI's behavior, cost, and quality. Let's look at why AI observability is different.
What is AI observability
AI observability is the practice of monitoring, understanding, and debugging complex AI systems by analyzing telemetry data like metrics, logs, and traces. It transforms "black box" models into transparent, trustworthy systems by monitoring response quality, drift, and costs.
Why AI observability is actually different
I spent years doing traditional backend observability. Logs, metrics, traces—the standard playbook. Then I started building with LLMs and realized none of it translated directly.
Here's why AI observability is different:
- Non-deterministic outputs. Same input doesn't guarantee the same output. A request can "succeed" technically but still give a terrible response. How do I even measure that?
- Cost is now a performance metric. With regular APIs, I care about latency and error rates. With LLMs, I'm also tracking tokens because every request costs real money. A slow database query is annoying. An inefficient prompt costs me hundreds of dollars a month.
- Quality can't be measured with status codes.
HTTP 200doesn't mean the AI gave a good answer. It just means the API call worked. We need to actually evaluate whether the response was useful, accurate, or even made sense. - The entire request flow matters. Modern AI apps chain multiple calls together. One user request might trigger three LLM calls, two database queries, and an embedding lookup. We need to trace the whole thing, not just individual API calls.
Traditional observability answers did it work? AI observability needs to answer did it work well, and what did it cost?
What's worth monitoring?
After building several AI features in production level apps, I've narrowed it down to three areas that actually matter:
1. Tracing: Following the request path
I need to see the complete journey—what prompt went in, what came out, how long it took, and how many tokens it used. When a user reports a bad response, I should be able to pull up that exact request and see what happened.
This includes:
- The full prompt (including system messages and context)
- The model's complete response
- Token counts (prompt tokens + completion tokens)
- Latency at each step
- Which model version was used
2. Cost monitoring: Token usage tracking
LLM costs add up fast. I learned this when a single poorly optimized endpoint was responsible for 60% of my monthly OpenAI bill.
What I track now:
- Cost per user (for usage-based pricing)
- Cost per endpoint/feature
- Token usage trends over time
- Expensive outlier requests
- Cache hit rates (if using prompt caching)
3. Quality evaluation
This is the hardest part. How do you know if an AI response was good?
Approaches that work here are:
- User feedback (thumbs up or down buttons)
- Automated checks (does it contain expected information?)
- Sampling and manual review
- Comparing against expected outputs for known test cases
AI observability tools that actually help
I've tried a bunch of AI observability tools including LangSmith, LangFuse, Helicone, OpenLLMetry, DataDog, New Relic, AppSignal. Here's what I found and when to use each.
- Open-source and built on OpenTelemetry standards
- Works with any LLM provider (OpenAI, Anthropic, etc.)
- Gives me full control over what gets logged
- Free to use with a free cloud dashboard available
- Use when: Building something custom or want full data ownership
- Drop-in proxy—just change the API base URL
- Zero code changes required
- Focuses heavily on cost tracking and caching
- Clean, simple dashboard
- Use when: When you want quick setup without modifying existing code
- Open-source with a nice UI
- Good for prompt versioning and evals
- Can self-host or use their cloud
- Use when: When you need to manage multiple prompt versions
- Full-featured but tied to LangChain ecosystem
- Best-in-class if already using LangChain
- Use when: When you already using LangChain
Enterprise options (DataDog, New Relic, AppSignal):
- Traditional APM tools adding AI features
- Use when: When you already have these and want everything in one place, these are good options
I use OpenLLMetry for detailed tracing and Helicone for quick cost monitoring. They complement each other well. Let's look at how to set them up.
Setting up OpenLLMetry
The installation is simple. OpenLLMetry wraps your LLM calls with automatic instrumentation. Every request gets traced without cluttering your code.
Installation:
npm install @traceloop/node-server-sdk openai
Basic setup:
import * as traceloop from "@traceloop/node-server-sdk";

// Initialize Traceloop BEFORE importing any LLM libraries
traceloop.initialize({
  disableBatch: true,
  apiKey: process.env.TRACELOOP_API_KEY,
});

// Use OpenAI SDK pointed at Gemini's OpenAI-compatible endpoint
// This is fully supported by Traceloop's instrumentation
const { default: OpenAI } = await import("openai");

const client = new OpenAI({
  apiKey: process.env.GEMINI_API_KEY,
  baseURL: "https://generativelanguage.googleapis.com/v1beta/openai/",
});

async function generateSummary(text) {
    return await traceloop.withTask({name: "generate-summary"}, async () => {
        const response = await client.chat.completions.create({
            model: "gemini-2.5-flash",
            messages: [
                { role: "system", content: "Summarize the following text concisely in under 30 words only." },
                { role: "user", content: text },
            ],
            max_tokens: 1024,
        });
        return response.choices[0].message.content;
    })
}
That's it. Every LLM call now gets logged with:
- Input prompt and output completion
- Token usage (prompt + completion)
- Latency timing
- Model used
- Any errors or retries
Here's the dashboard:
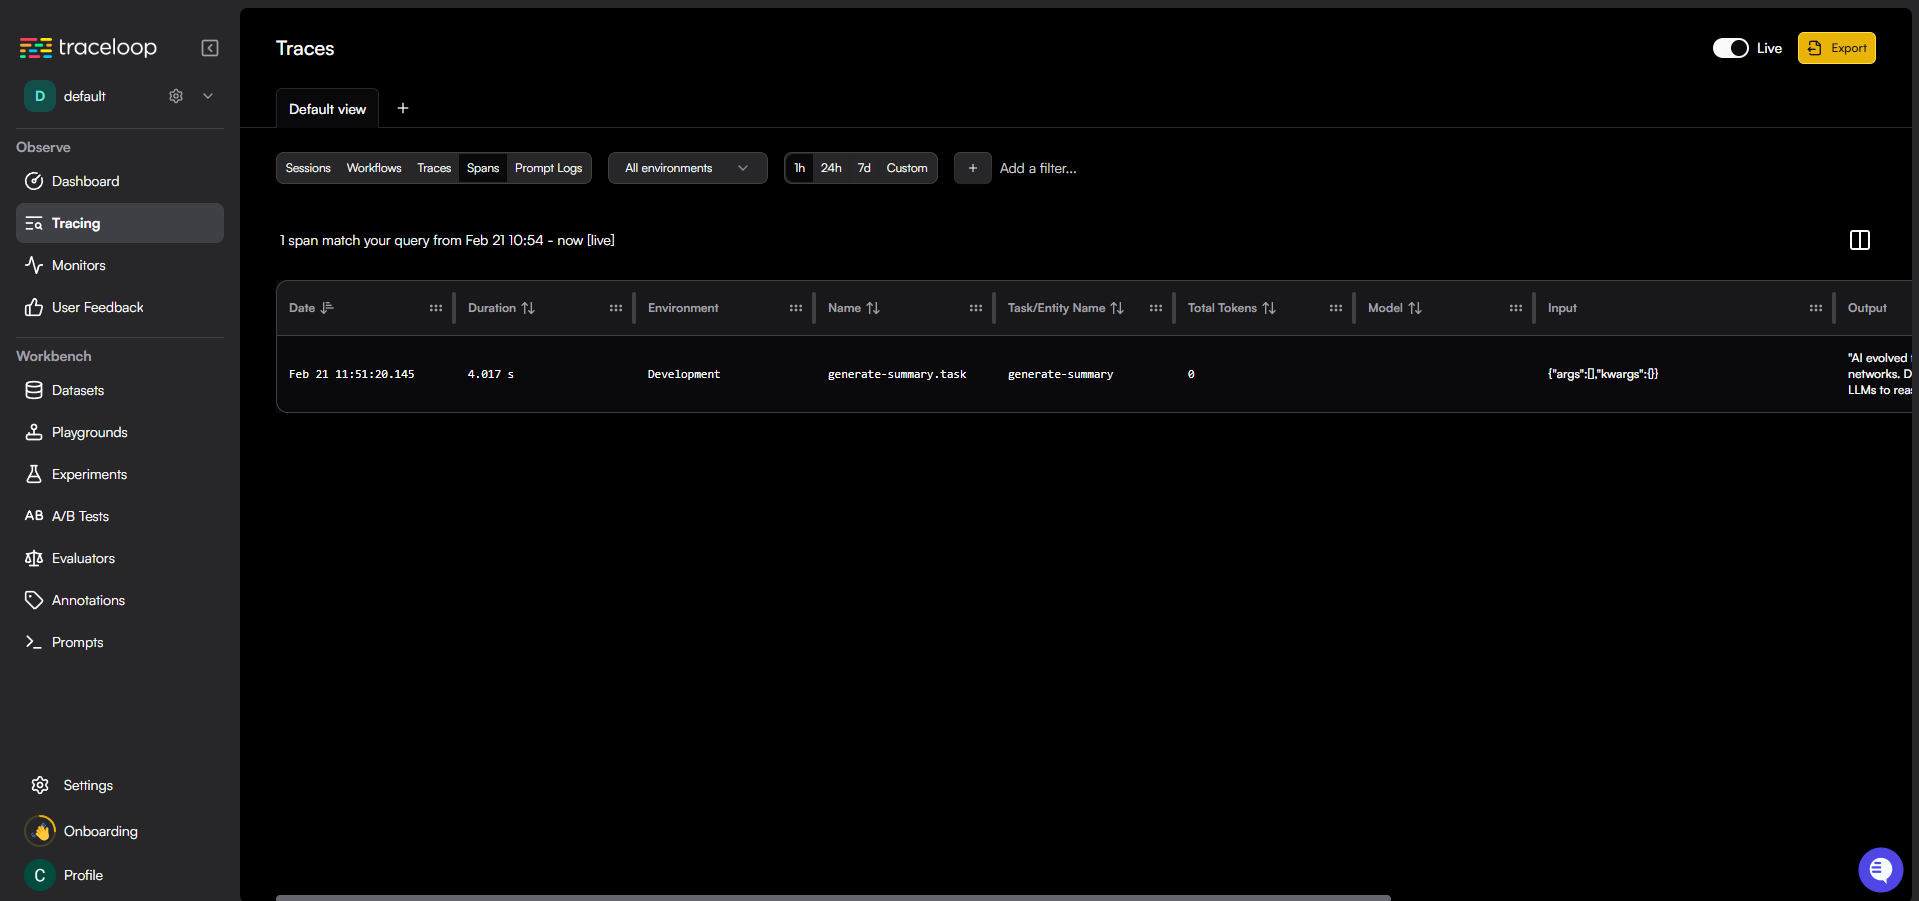
The beauty of OpenLLMetry is it uses OpenTelemetry under the hood. This means I can export traces to any observability backend that supports OTEL—Jaeger, Grafana, even DataDog if needed.
Setting Up Helicone (The zero-code way)
Sometimes I just want quick visibility without touching my codebase. That's where Helicone shines. It works as a proxy—requests go through Helicone to OpenAI, and Helicone logs everything in between.
Setup:
import OpenAI from 'openai';

const openai = new OpenAI({
  apiKey: process.env.HELICONE_API_KEY,
  baseURL: 'https://ai-gateway.helicone.ai/v1',
});

const completion = await openai.chat.completions.create({
  model: 'gemini-2.5-flash',
  messages: [
    {
      role: 'user',
      content: "artifficial intelligence has evolved from rule-based systems to neural networks that resemble human cognition. Early AI used symbolic AI for specific tasks but could not learn independently. Machine learning and deep learning allowed neural networks to identify patterns in data. The Transformer architecture, developed by Google, enabled models to process data sequences simultaneously. This led to Large Language Models (LLMs) that can reason, code, and summarize information"
    }
  ]
});

console.log(completion.choices[0].message.content);
Two lines changed, and now I get:
- Real-time cost tracking per request
- Token usage analytics
- Request caching (reduces costs)
- Rate limit monitoring
- Geographic latency insights
Here's the dashboard:
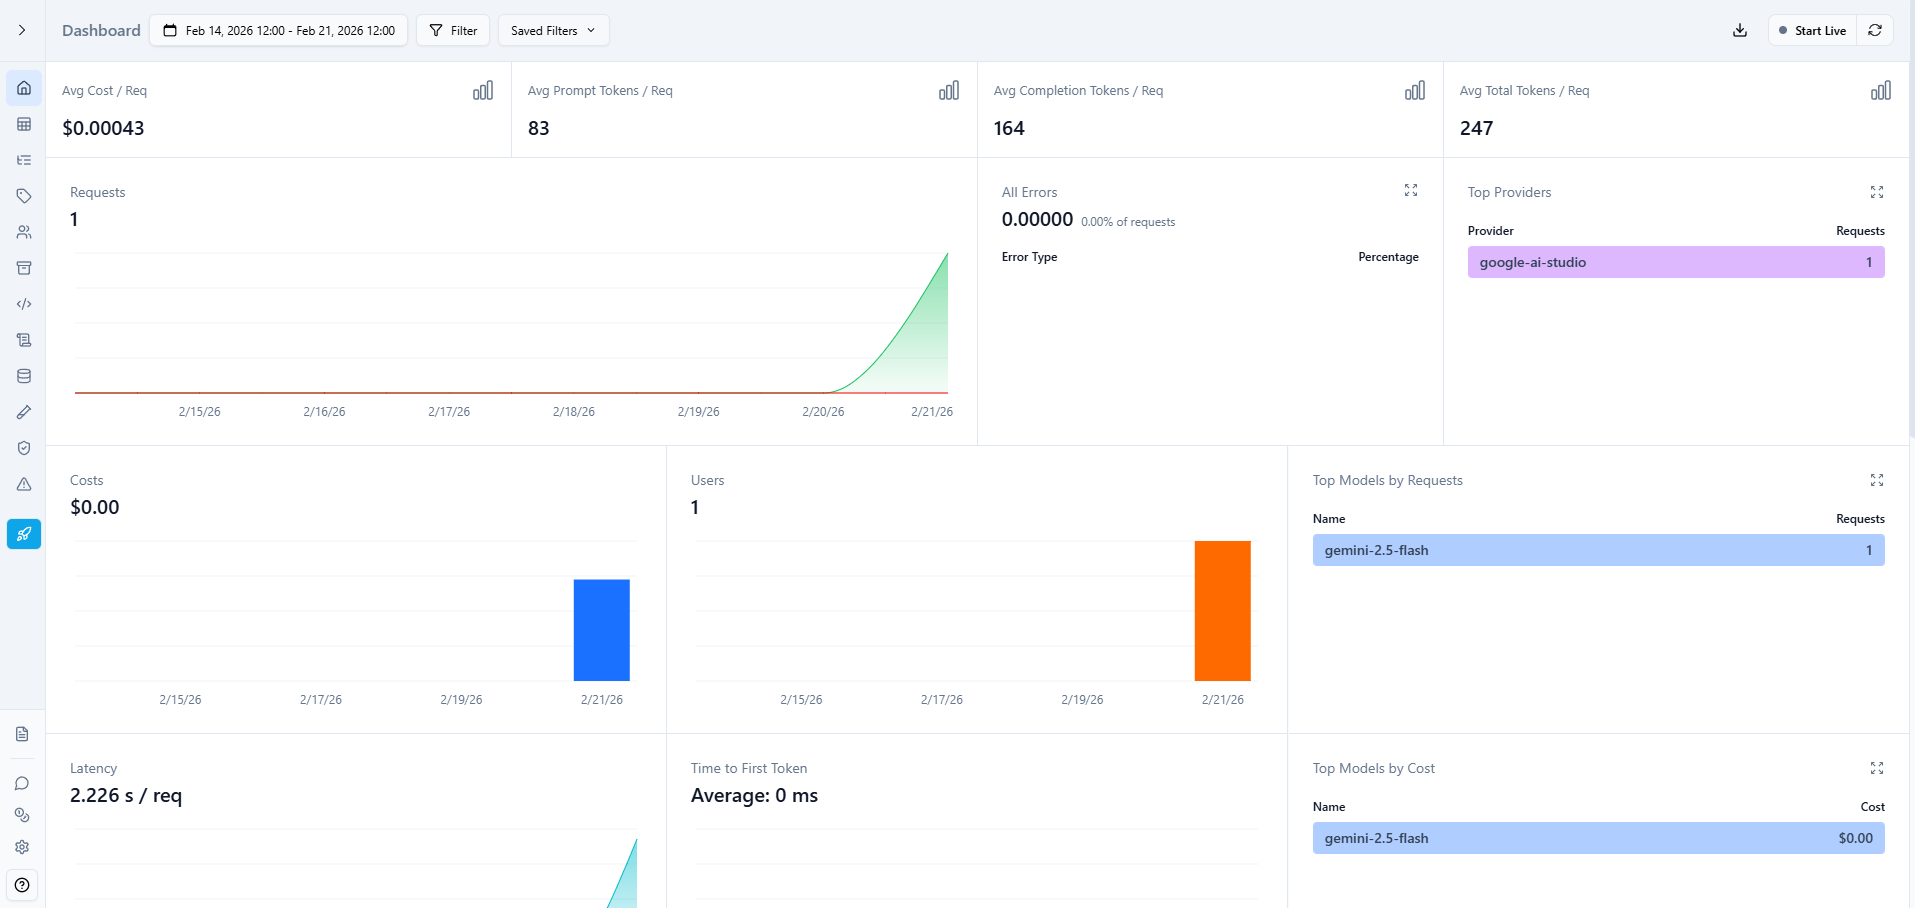
The cost tracking is where Helicone really helps. I can see exactly which endpoints are expensive, which users are consuming the most tokens, and where I should optimize.
What to actually monitor in production
Coming from a traditional software engineering background and now working with AI, here's what I monitor:
Cost metrics:
- Daily spend vs. budget
- Cost per user/session
- Most expensive endpoints (I'm looking at you, GPT-5.2)
- Alert if daily cost exceeds threshold
Performance metrics:
- P95 latency (not average-outliers matter)
- Token usage per request
- Cache hit rate (if using caching)
- Rate limit proximity
Quality metrics:
- User feedback scores
- Responses that triggered follow-ups
- Completion length trends
- Error rates (both API errors and "empty" responses)
Usage patterns:
- Peak request times
- Most-used features
- Token waste (requests with high prompt/low completion ratio)
Most importantly, I set up alerts for:
- Daily cost exceeding $x
- Latency P95 above 5 seconds
- Error rate above 2%
- Any request costing more than $0.50 (this was a game changer)
The reality check
In 2026, AI observability isn't optional anymore. I learned this the expensive way-literally. Without proper monitoring, I had no idea one feature was costing me $200/month while barely being used.
Where do you start? Add Helicone as a proxy today (takes 5 minutes). See where your money goes, how much you spend on tokens, latency, etc. Then layer in OpenLLMetry or a similar tool for deeper tracing. Build evaluation systems as you scale.
The goal isn't perfect observability from day one. It's having enough visibility to answer: "Why did this cost so much?" and "Why did the AI respond that way?" Can we do better? Yes we can.
Traditional logs won't tell you. These tools will.
Happy coding!
Want content like this for your blog? Connect with me on LinkedIn or X (Twitter). I'd love to help!